<RadarChart/>
Component Renders a sequence of equi-angular spokes called radii with an overlayed area((<RadarArea/>) to provide comparisons of the dataset.
Props
width <String> || <Number>
The width you want to set the chart too.
height <String> || <Number>
The height you want to set the chart too.
data <Array>
The data you want to the chart to use.
rangeKey <String> || <Number>
A key on the data prop for which to use to draw the RadarChart. This prop has to be set.
labelKey <String> || <Number>
A key on the data prop for which to use to label the slices of the RadarChart. This prop has to be set.
Examples
var data5 = [
{ "skill": "field", y: 16, k1: 10, k2: 20 },
{ "skill": "field1", y: 10, k1: 12, k2: 22 },
{ "skill": "field2", y: 10, k1: 13, k2: 9 },
{ "skill": "field3", y: 11, k1: 14, k2: 16 },
{ "skill": "field4", y: 15, k1: 15, k2: 19 },
{ "skill": "field5", y: 22, k1: 16, k2: 22 }
];
<RadarChart width={350}
height={300}
data={data}
rangeKey='y'
labelKey='skill'>
<RadarArea dataKey='k1' color='blue' colorOpacity='.7'/>
<RadarArea dataKey='k2' color='red' colorOpacity='.7'/>
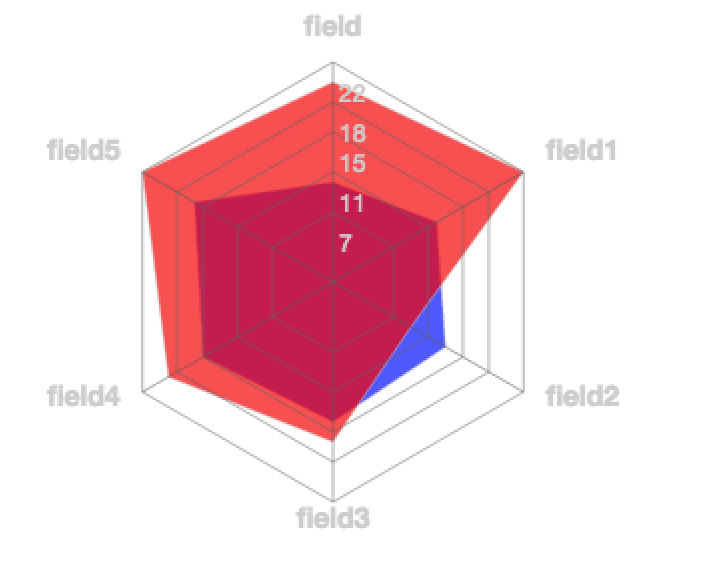
</RadarChart>
Sample RadarChart