<XYAxis/>
Component Renders XY Axis, as well as optionally a grid.
Props
xyConfig
The xyConfig is an optional prop on the component, it should be used if you don’t want to have a bunch or different props but rather just on prop that takes in an object config.
width
Takes in a number as the width that you want to set the XYAxis too.
height
Takes in a number as the height you want to set the XYAxis too
data
The data the XYAxis will consume to create the scales of the Axis
xDataKey
Takes in a number or a string as the field on the data prop to use to populate the xAxis scale
yDataKey
takes in a number or a string as the field on the data prop to use to populate the yAxis scale
defaultOrdinal
Say you pass in numbers for a scale, by default they will be treated as a linear scale. However say there are to represent years the XYAxis
will show it as 2,009 2,010 etc. when you really want it to be shown as 2009 2010 etc. this prop takes in one of the following options:
x, y, xy as the value of the prop. This means if you pass in x
the x-axis will be treated as an ordinal scale even if it is numbers.
xTicks
Takes in a number as The number of ticks to show on the xAxis
yTicks
Takes in a number as The number of ticks to show on the yAxis
xLabel
Takes in a String for what you want to label the xAxis.
yLabel
Takes in a String for what you want to label the yAxis.
grid
Takes in either true or false, if you pass in true then it will
draw grid lines. Otherwise it won’t
gridLines
Takes in either solid or dashed, if solid the grid lines will be solid, if you pass in dashed the grid lines will be dashed.
Examples
//Without xyConfig
<XYAxis width={300}
        height={300}
        data={someData}
        xDataKey='xKey'
        yDataKey='yKey'
        defaultOrdinal='x'
        xTicks={5}
        yTicks={5}
        xLabel='x-axis'
        yLabel='y-axis'
        grid={true}
        gridLines='solid'
>
  ... // the child chart component
</XYAxis>

//With xyConfig
<XYAxis xyConfig=
>
  ... // the child chart component
</XYAxis>

//With A chart
<XYAxis width={300}
        height={300}
        data={someData}
        xDataKey='xKey'
        yDataKey='yKey'
        defaultOrdinal='x'
        xTicks={5}
        yTicks={5}
        xLabel='x-axis'
        yLabel='y-axis'
        grid={true}
        gridLines='solid'
>
  <AreaChart dataKey='a' color="blue"/>
</XYAxis>
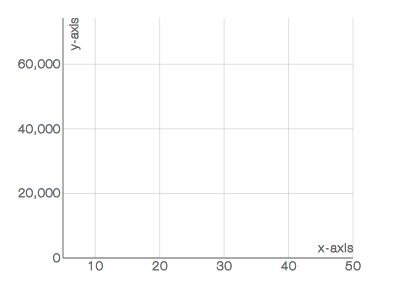
Sample XYAxis